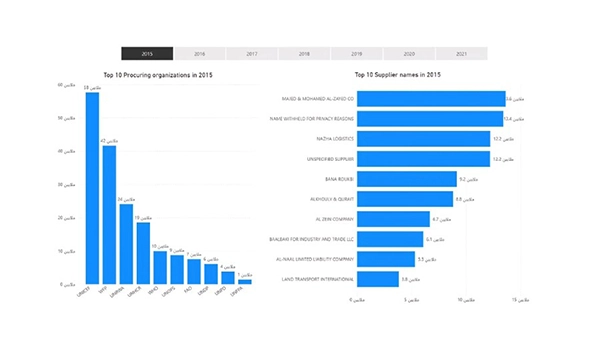
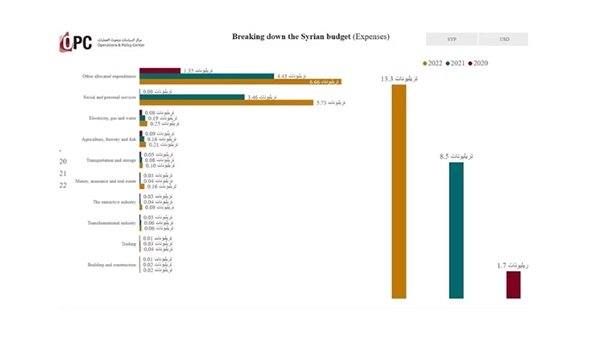
Home»Our work»Research tools Research tools The tools provided in this section help Syria analysts navigate large datasets and access reliable information for their research on various economic and political topics using intuitive and interactive visualizations. 22/05/2024 Top 100 Syrian Private and Public-Private Suppliers to Various UN Agencies in 2021 and 2022 Interactive tool by OPEN mapping top 100 Syrian UN suppliers (2021–2022) with risk classifications. Read More 24/10/2022 UN Procurement Contracts in Syria: Top 100 Syrian Private and Public-Private Suppliers to Various UN Agencies in 2019 and 2020 Interactive map by OPEN and Syrian Legal Development Programme of UN’s top 100 Syrian suppliers. Read More 08/06/2022 Visualizing New Zealand’s Budgets (2018-2023) Explore New Zealand budget data (2018–2023) by year, type, portfolio, by Karam Shaar Advisory. Read More 17/04/2022 Visualizing UN Procurements from Syria (2015-2020) Interactive dashboard by OPC visualizing UN procurements from Syria (2015–2021), agencies, partners, and trends. Read More 17/01/2022 Visualizing Syria’s 2020, 2021, and 2022 Budgets Interactive dashboard by OPC visualizing Syria’s 2020–2022 budgets with line-by-line breakdowns. Read More 21/06/2022 Interactive Dashboard of Individuals Targeted by US and EU Syria Sanctions Interactive dashboard by Karam Shaar Advisory mapping individuals targeted by US and EU Syria sanctions. Read More Page1 Page2 Page3 Page4