 By Alameen Najjar, Syrian geospatial data scientist and founder of Syria From Above
The sudden collapse of the Assad regime on 8 December 2024 marked the end of the central phase of a conflict that left Syria deeply depopulated, physically shattered, and economically hollowed out. The year that followed was consequential, with the appointment of Ahmad al-Sharaa as interim president, the formation of a transitional government, and the eruption of deadly sectarian clashes in the west and the south. It culminated in the repeal of the US Caesar Act in late December 2025.
Although there were signs of recovery in 2025—including indicators consistent with economic growth, the return of more than three million Syrians, and improvements in basic services, reliable economic data remain scarce. A comprehensive assessment of recovery therefore remains difficult. To help address this gap, this article uses satellite-derived nighttime lights (NTL) to provide a neutral, data-driven assessment of Syria’s recovery one year after Assad.
NTL data primarily capture activity powered by formal, grid-connected electricity—such as public lighting, industry, and large commercial facilities—and do not register most off-grid solar or household-level power use. In areas with high solar adoption, such as in northeastern Syria, NTL may therefore understate local economic activity. The results should be interpreted as a proxy for grid-based recovery rather than a comprehensive measure of economic life. Our analysis finds signs of recovery in most major Syrian cities throughout 2025. However, this recovery is geographically fragmented and politically uneven.
Temporal Dynamics of Recovery
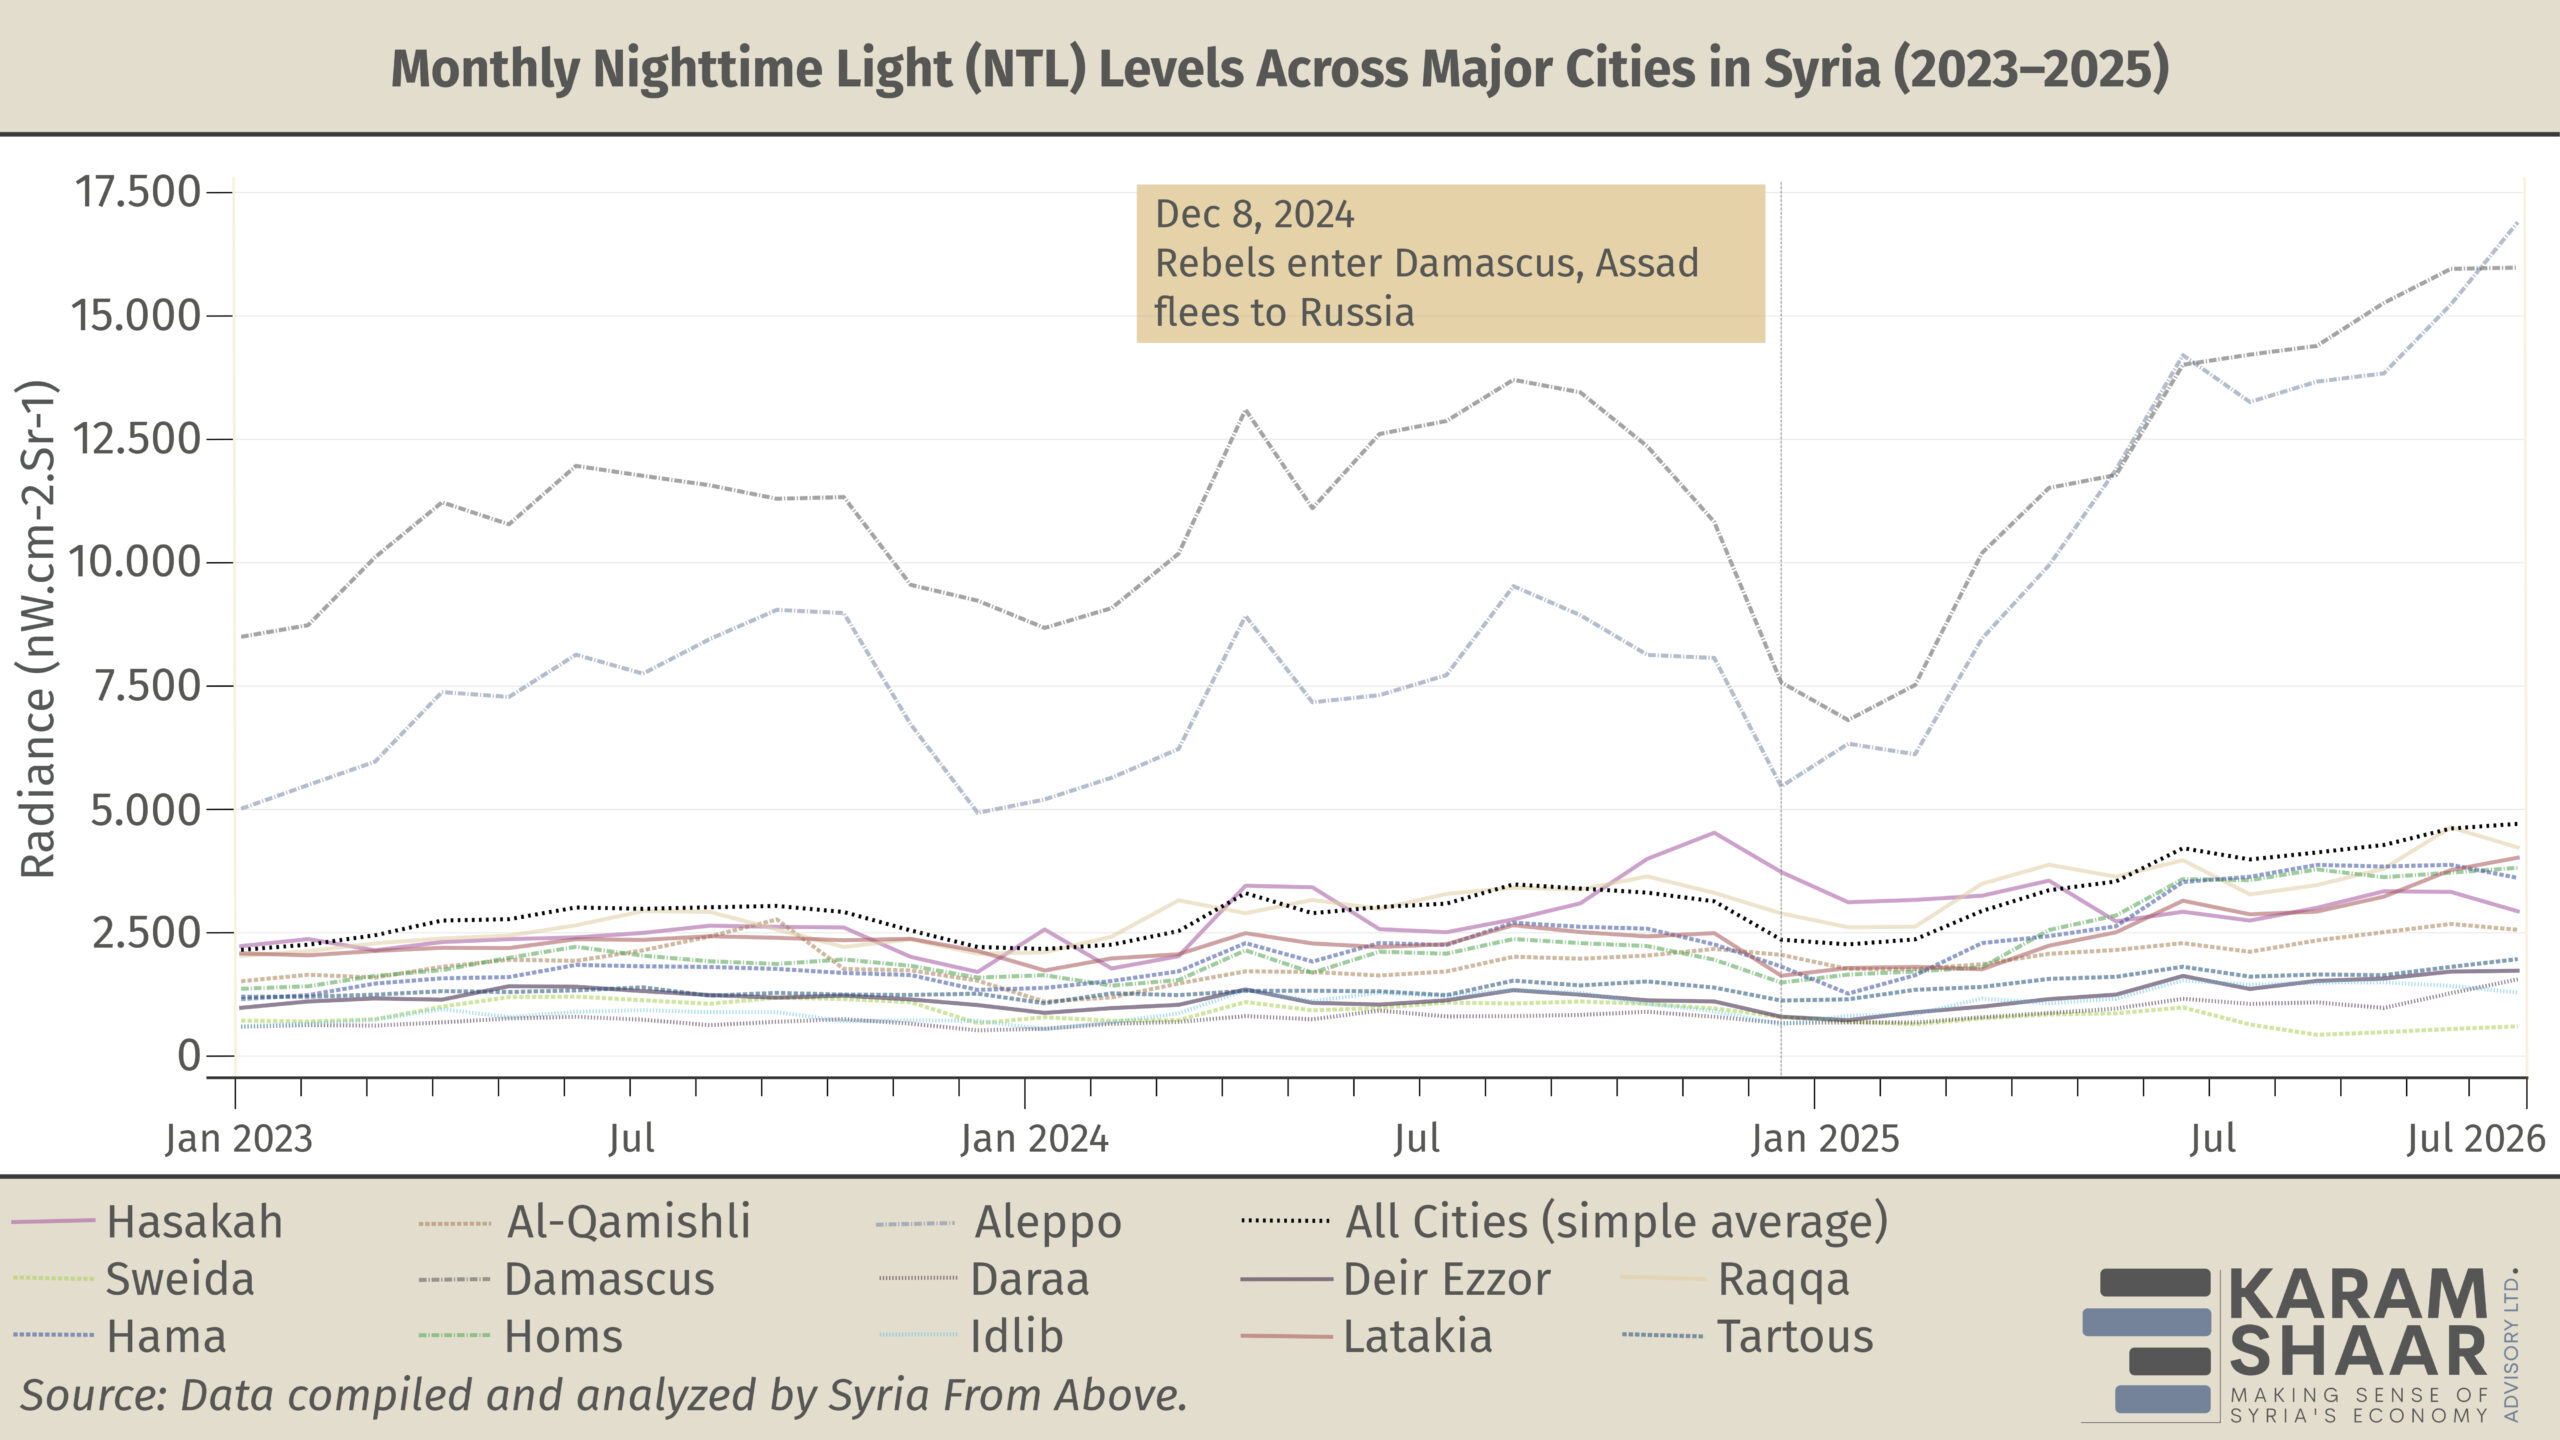
NTL data (see chart above) provide a three-year view of Syria’s trajectory. The data show a modest year-on-year increase in 2024, driven primarily by cities outside Assad’s control. The regime’s collapse marked a turning point that accelerated this trend while shifting its main geographic drivers.
By the time EU sanctions relief took effect in February 2025, Syria had entered a new phase in NTL dynamics. Growth accelerated sharply through May, reaching levels not seen since early 2023. This rise coincided with several developments, including the reported voluntary return of more than 600,000 refugees and targeted US sanctions relief on Syria’s Central Bank and ports.
The positive trend was briefly disrupted by a dip in July, which coincided with deadly sectarian clashes in As-Suwayda. The national aggregate recovered in August and continued to rise through November, the last month for which data are available. August also marked the activation of the SOCAR gas deal and the Kilis–Aleppo pipeline, which increased electricity generation and likely contributed to higher NTL levels.
The seasonal pattern of summer highs and winter lows visible in 2023 and 2024 is largely overridden by the steady nationwide increase observed in 2025. This suggests a potential structural recovery rather than a temporary weather-driven effect.
Spatial Dynamics of Recovery
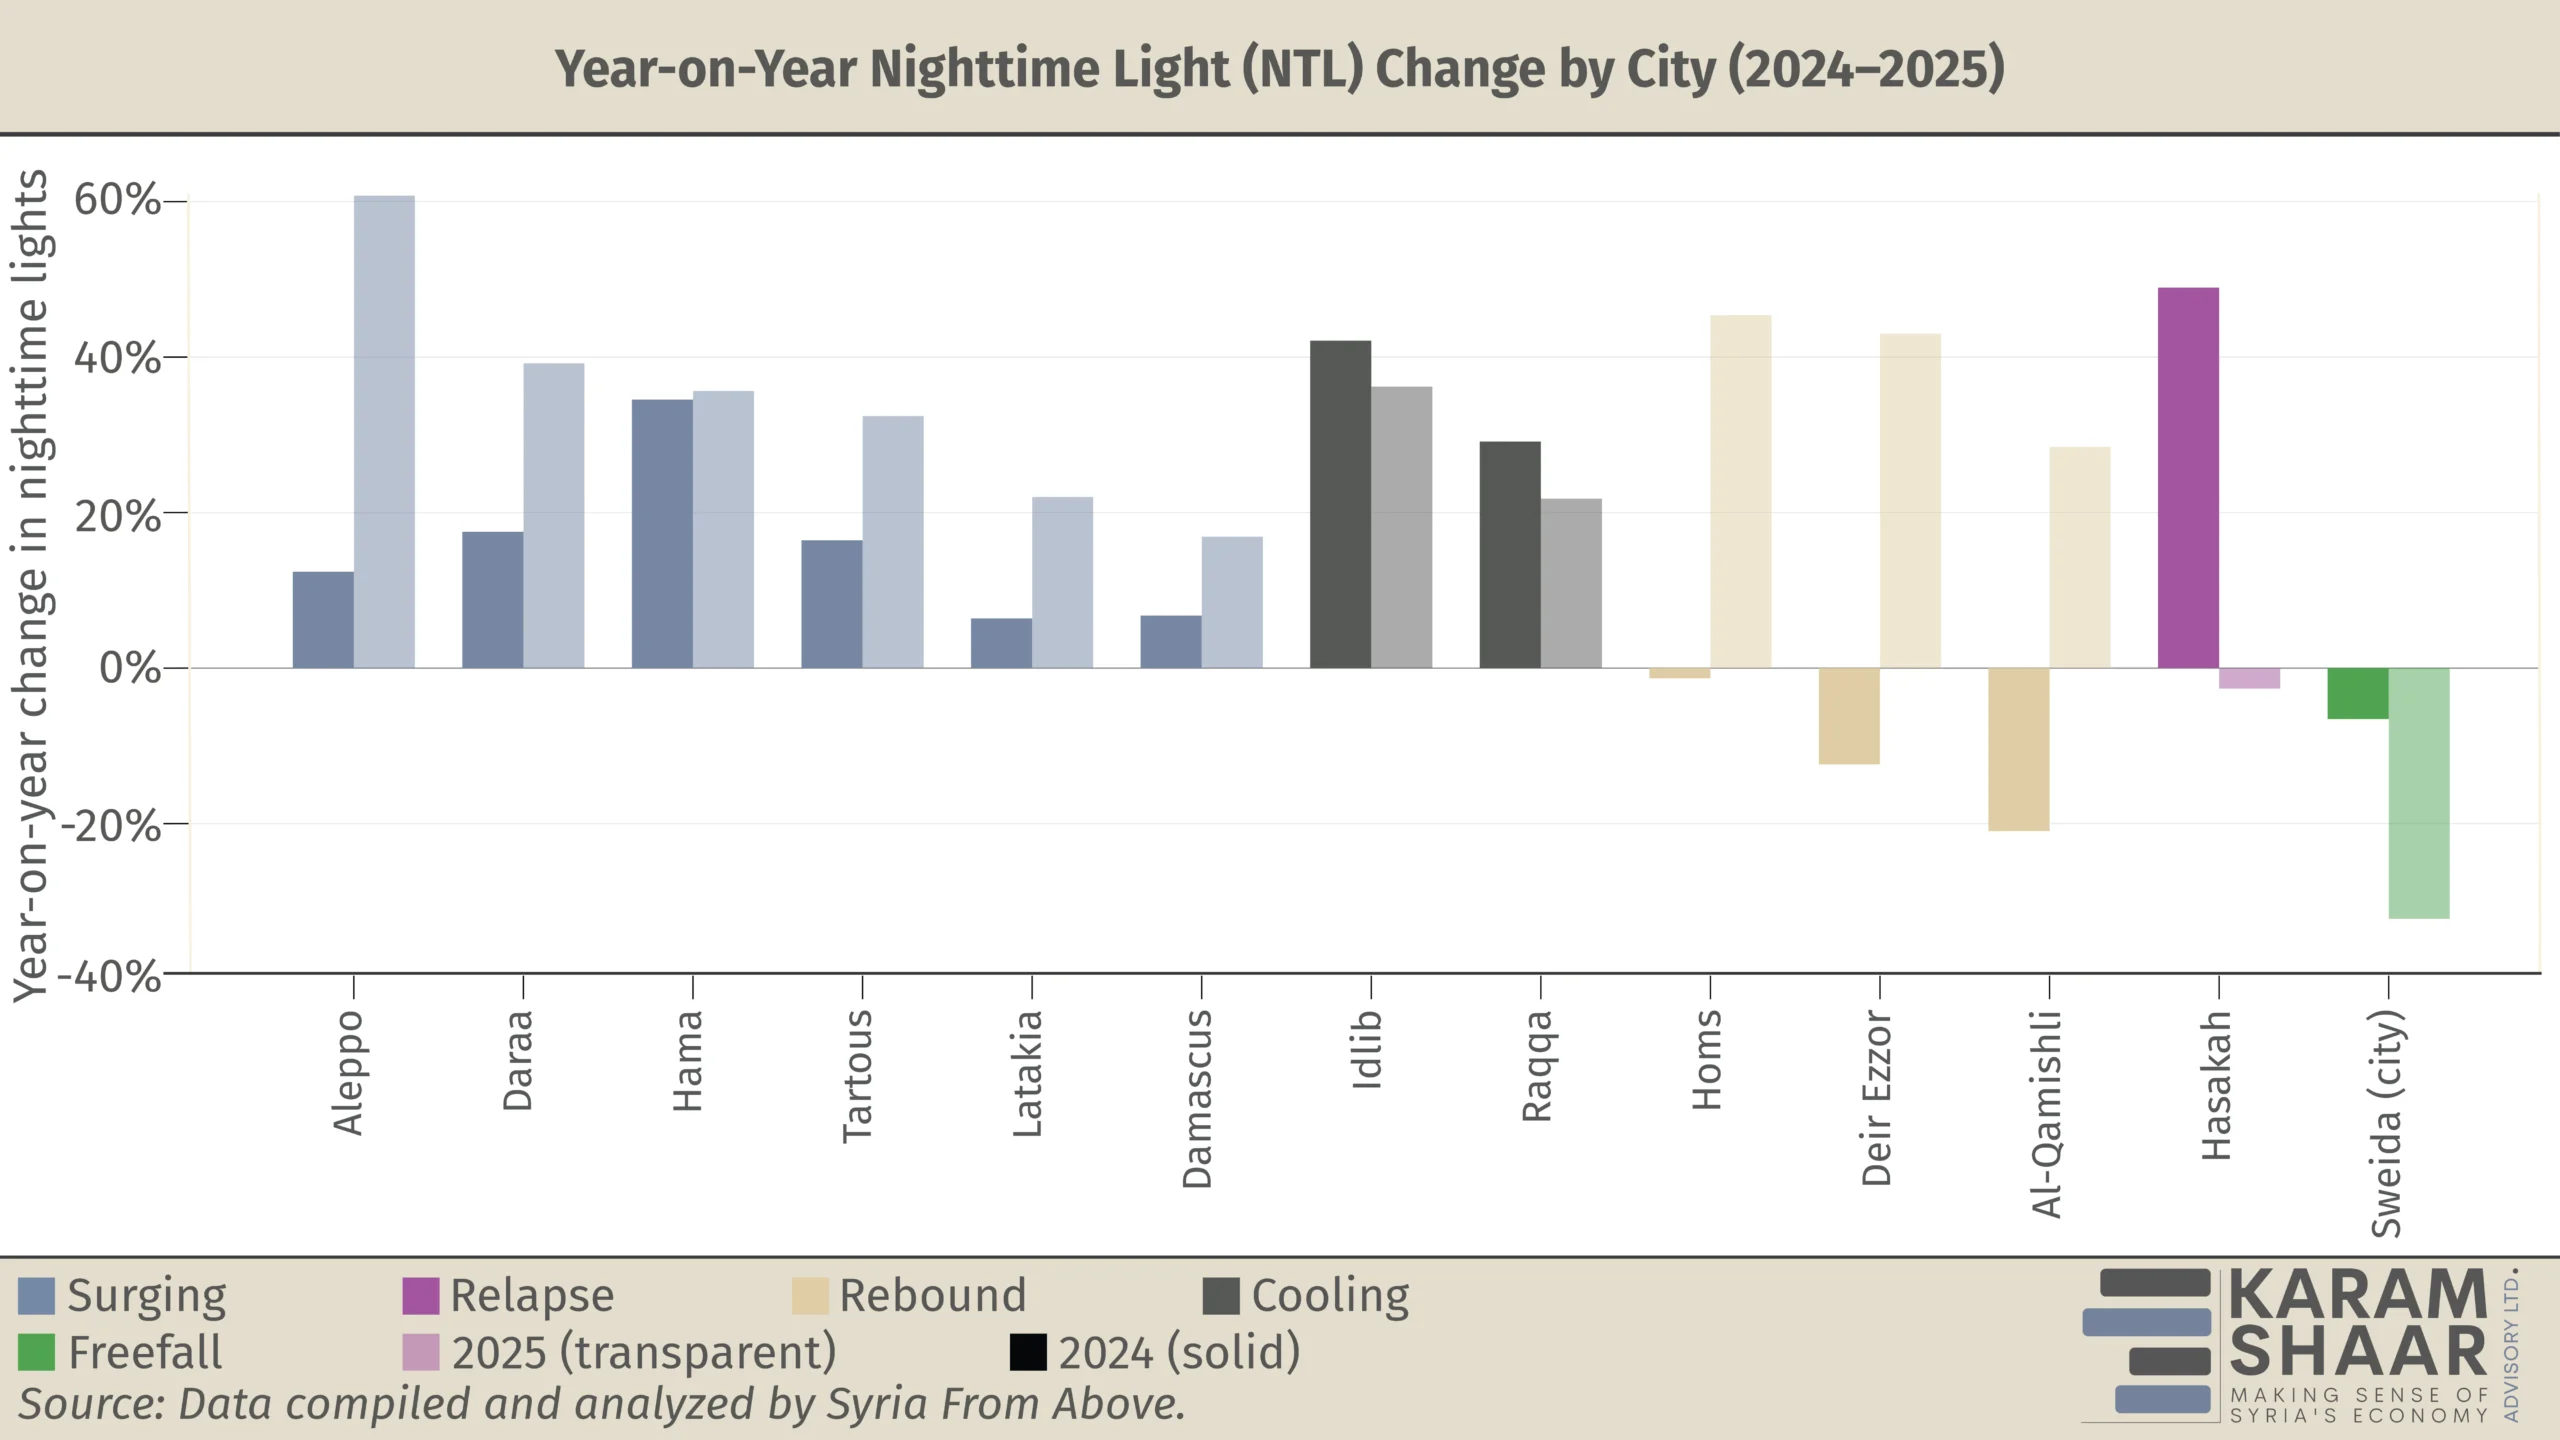
All major Syrian cities, with the exception of Sweida and Hasakah, recorded double-digit year-on-year NTL growth in 2025 (see chart above). When the 2024 baseline is included, however, the picture becomes more complex and reveals distinct patterns of momentum and stability.
For example, Aleppo did not simply grow by 61 percent in 2025; it also gained momentum following the collapse of the Assad regime. By contrast, Idlib and Raqqa recorded strong double-digit growth in 2025 but lost momentum compared to 2024, suggesting a slowing recovery.
At the other end of the spectrum, Sweida declined by 32 percent in 2025, extending an accelerated contraction that began in 2024. This trajectory was driven by sectarian clashes in July, which damaged power infrastructure through shelling and airstrikes and disrupted access to fuel and repairs through blockades and sabotage.
Together, these trends fall into five distinct NTL growth patterns across Syria’s major cities: Surging, Cooling, Rebound, Relapse, and Freefall. They show that recovery is shaped not only by scale, but also by direction and pace over time.
Spatial Distribution of Change
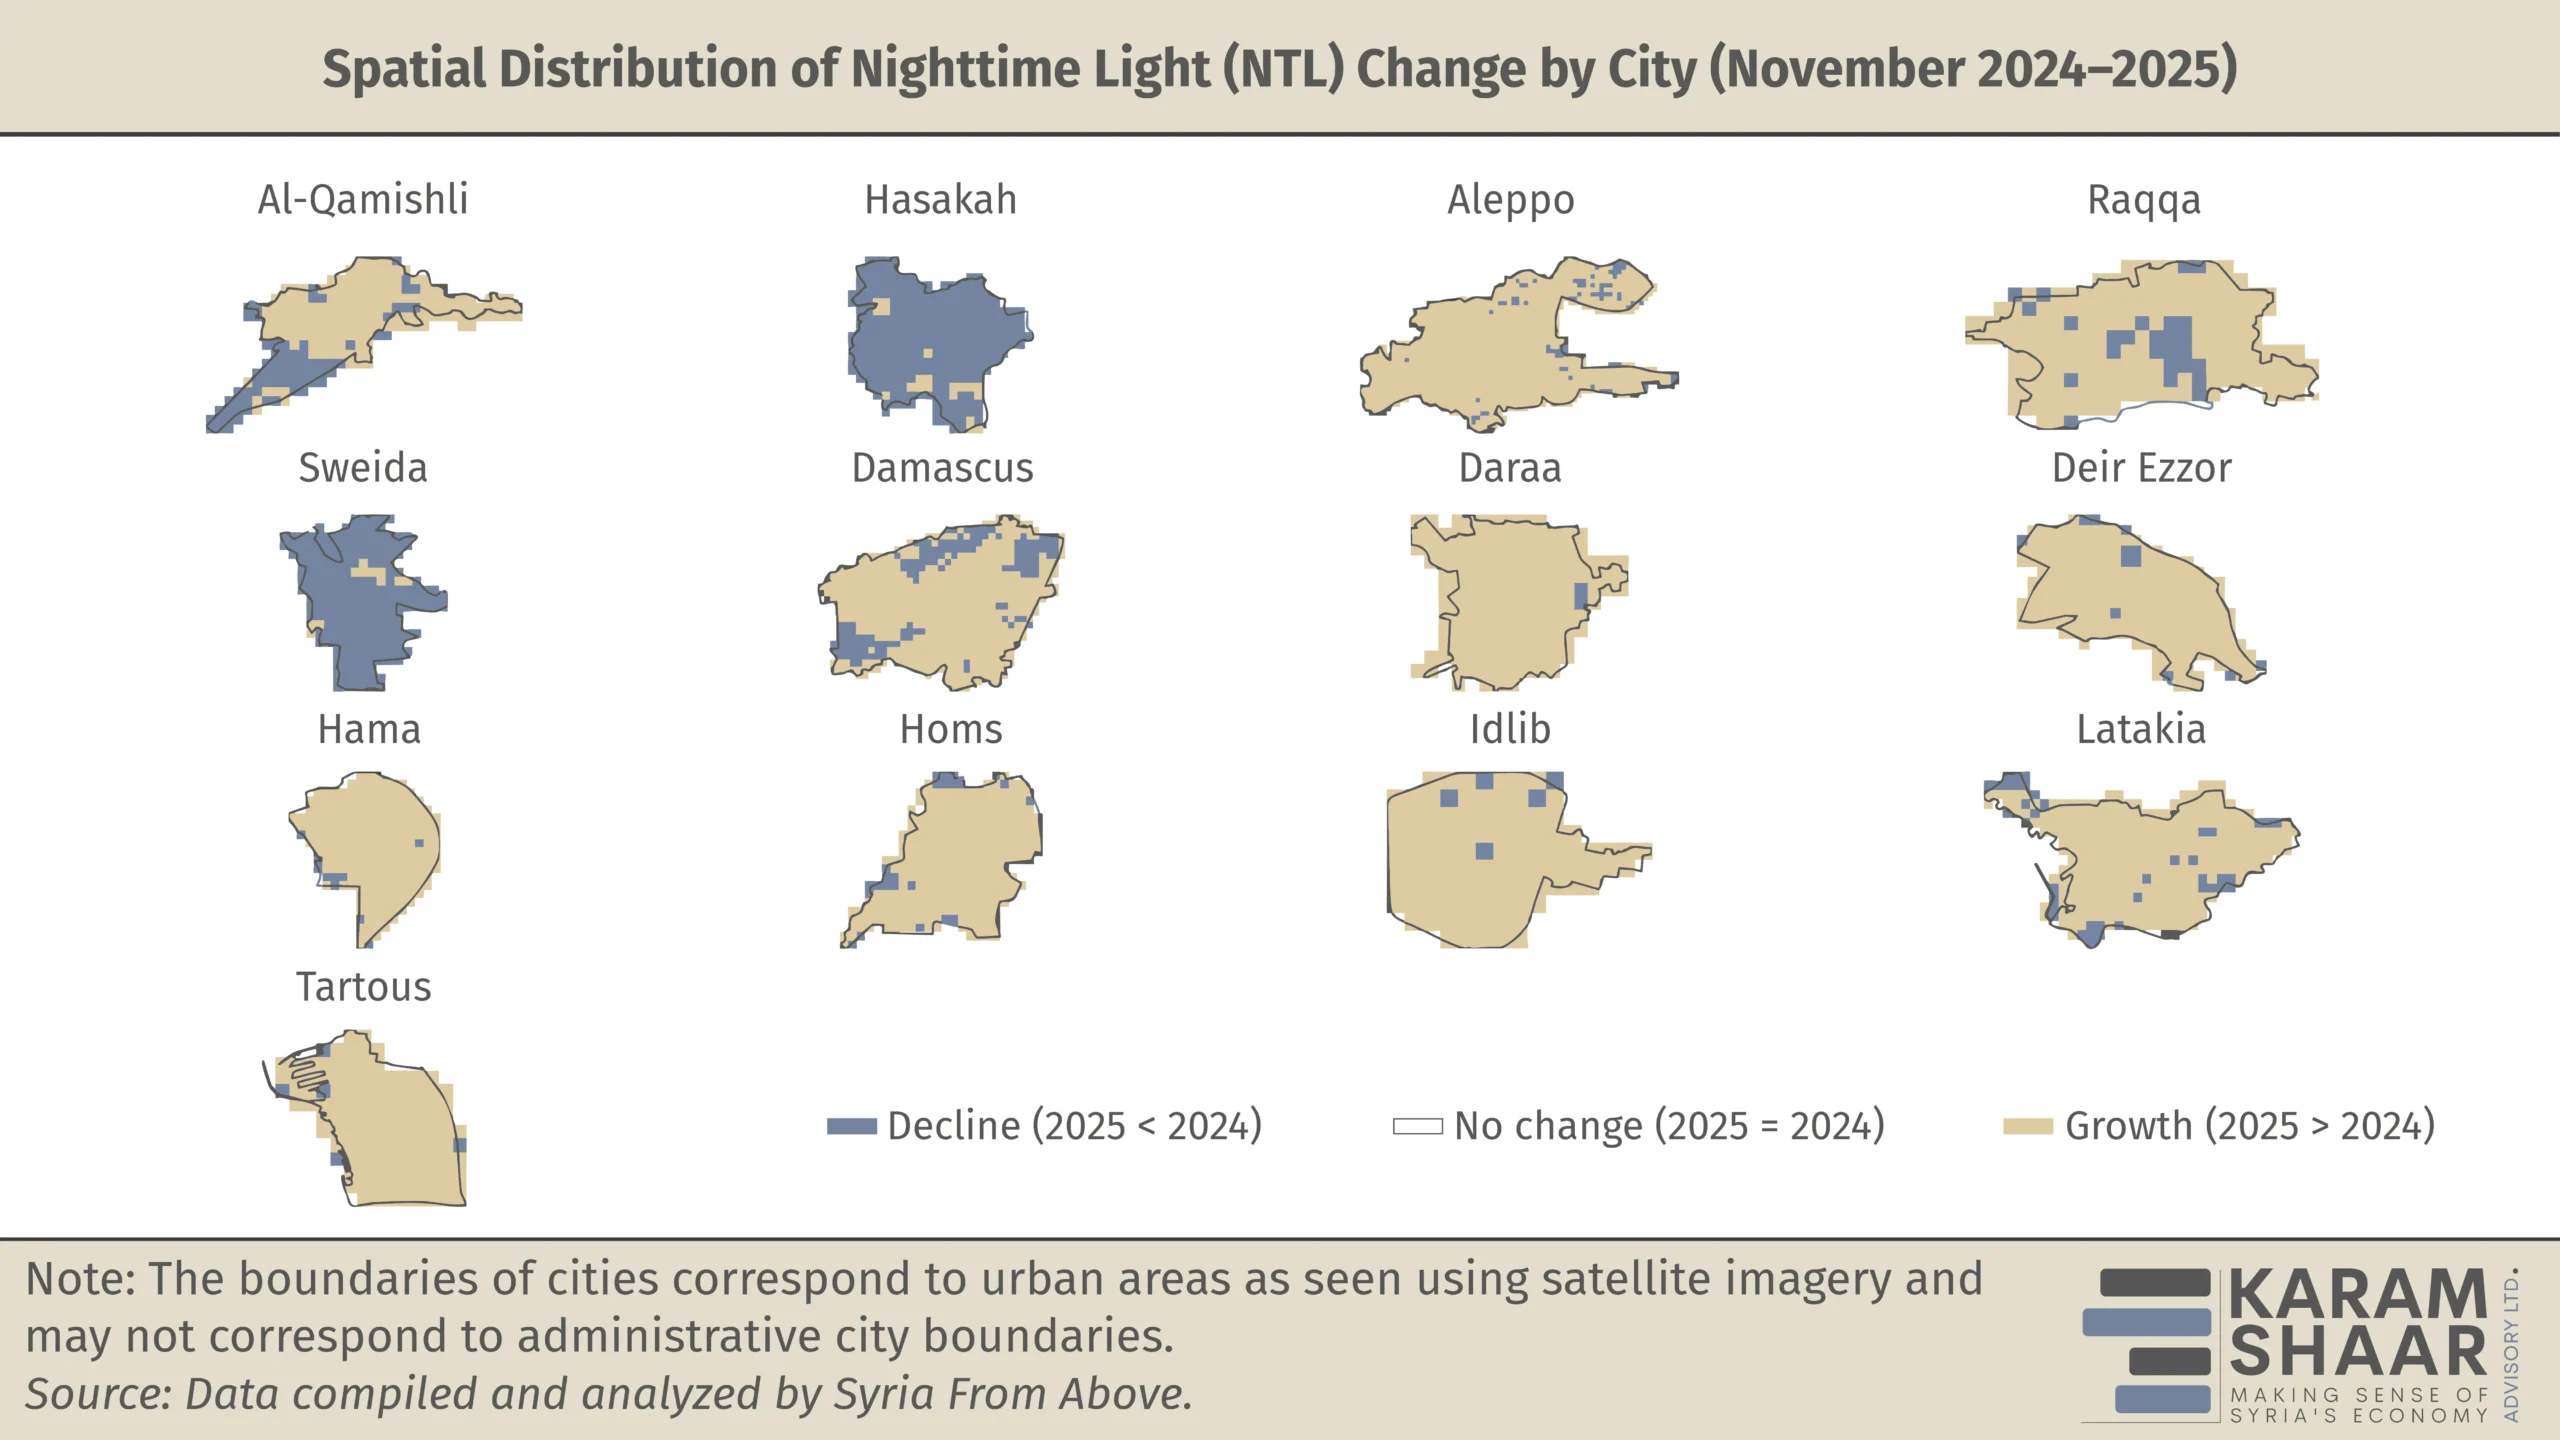
The chart above shows that most Syrian cities in 2025 experienced predominantly positive NTL growth, with only fragmented and localized pockets of decline. This pattern points to a broad increase in grid-based activity and electricity availability across most urban areas.
Al-Qamishli stands out as a partial exception. Although it recovered from a double-digit decline in 2024, large parts of the city still show contraction, indicating an uneven and incomplete recovery.
By contrast, Sweida and Hasakah exhibit widespread decline across nearly their entire urban areas, with only rare and highly localized cells of growth. This pattern suggests a deteriorating or severely constrained energy profile, with little evidence of sustained recovery.
The Political Determinants of Recovery
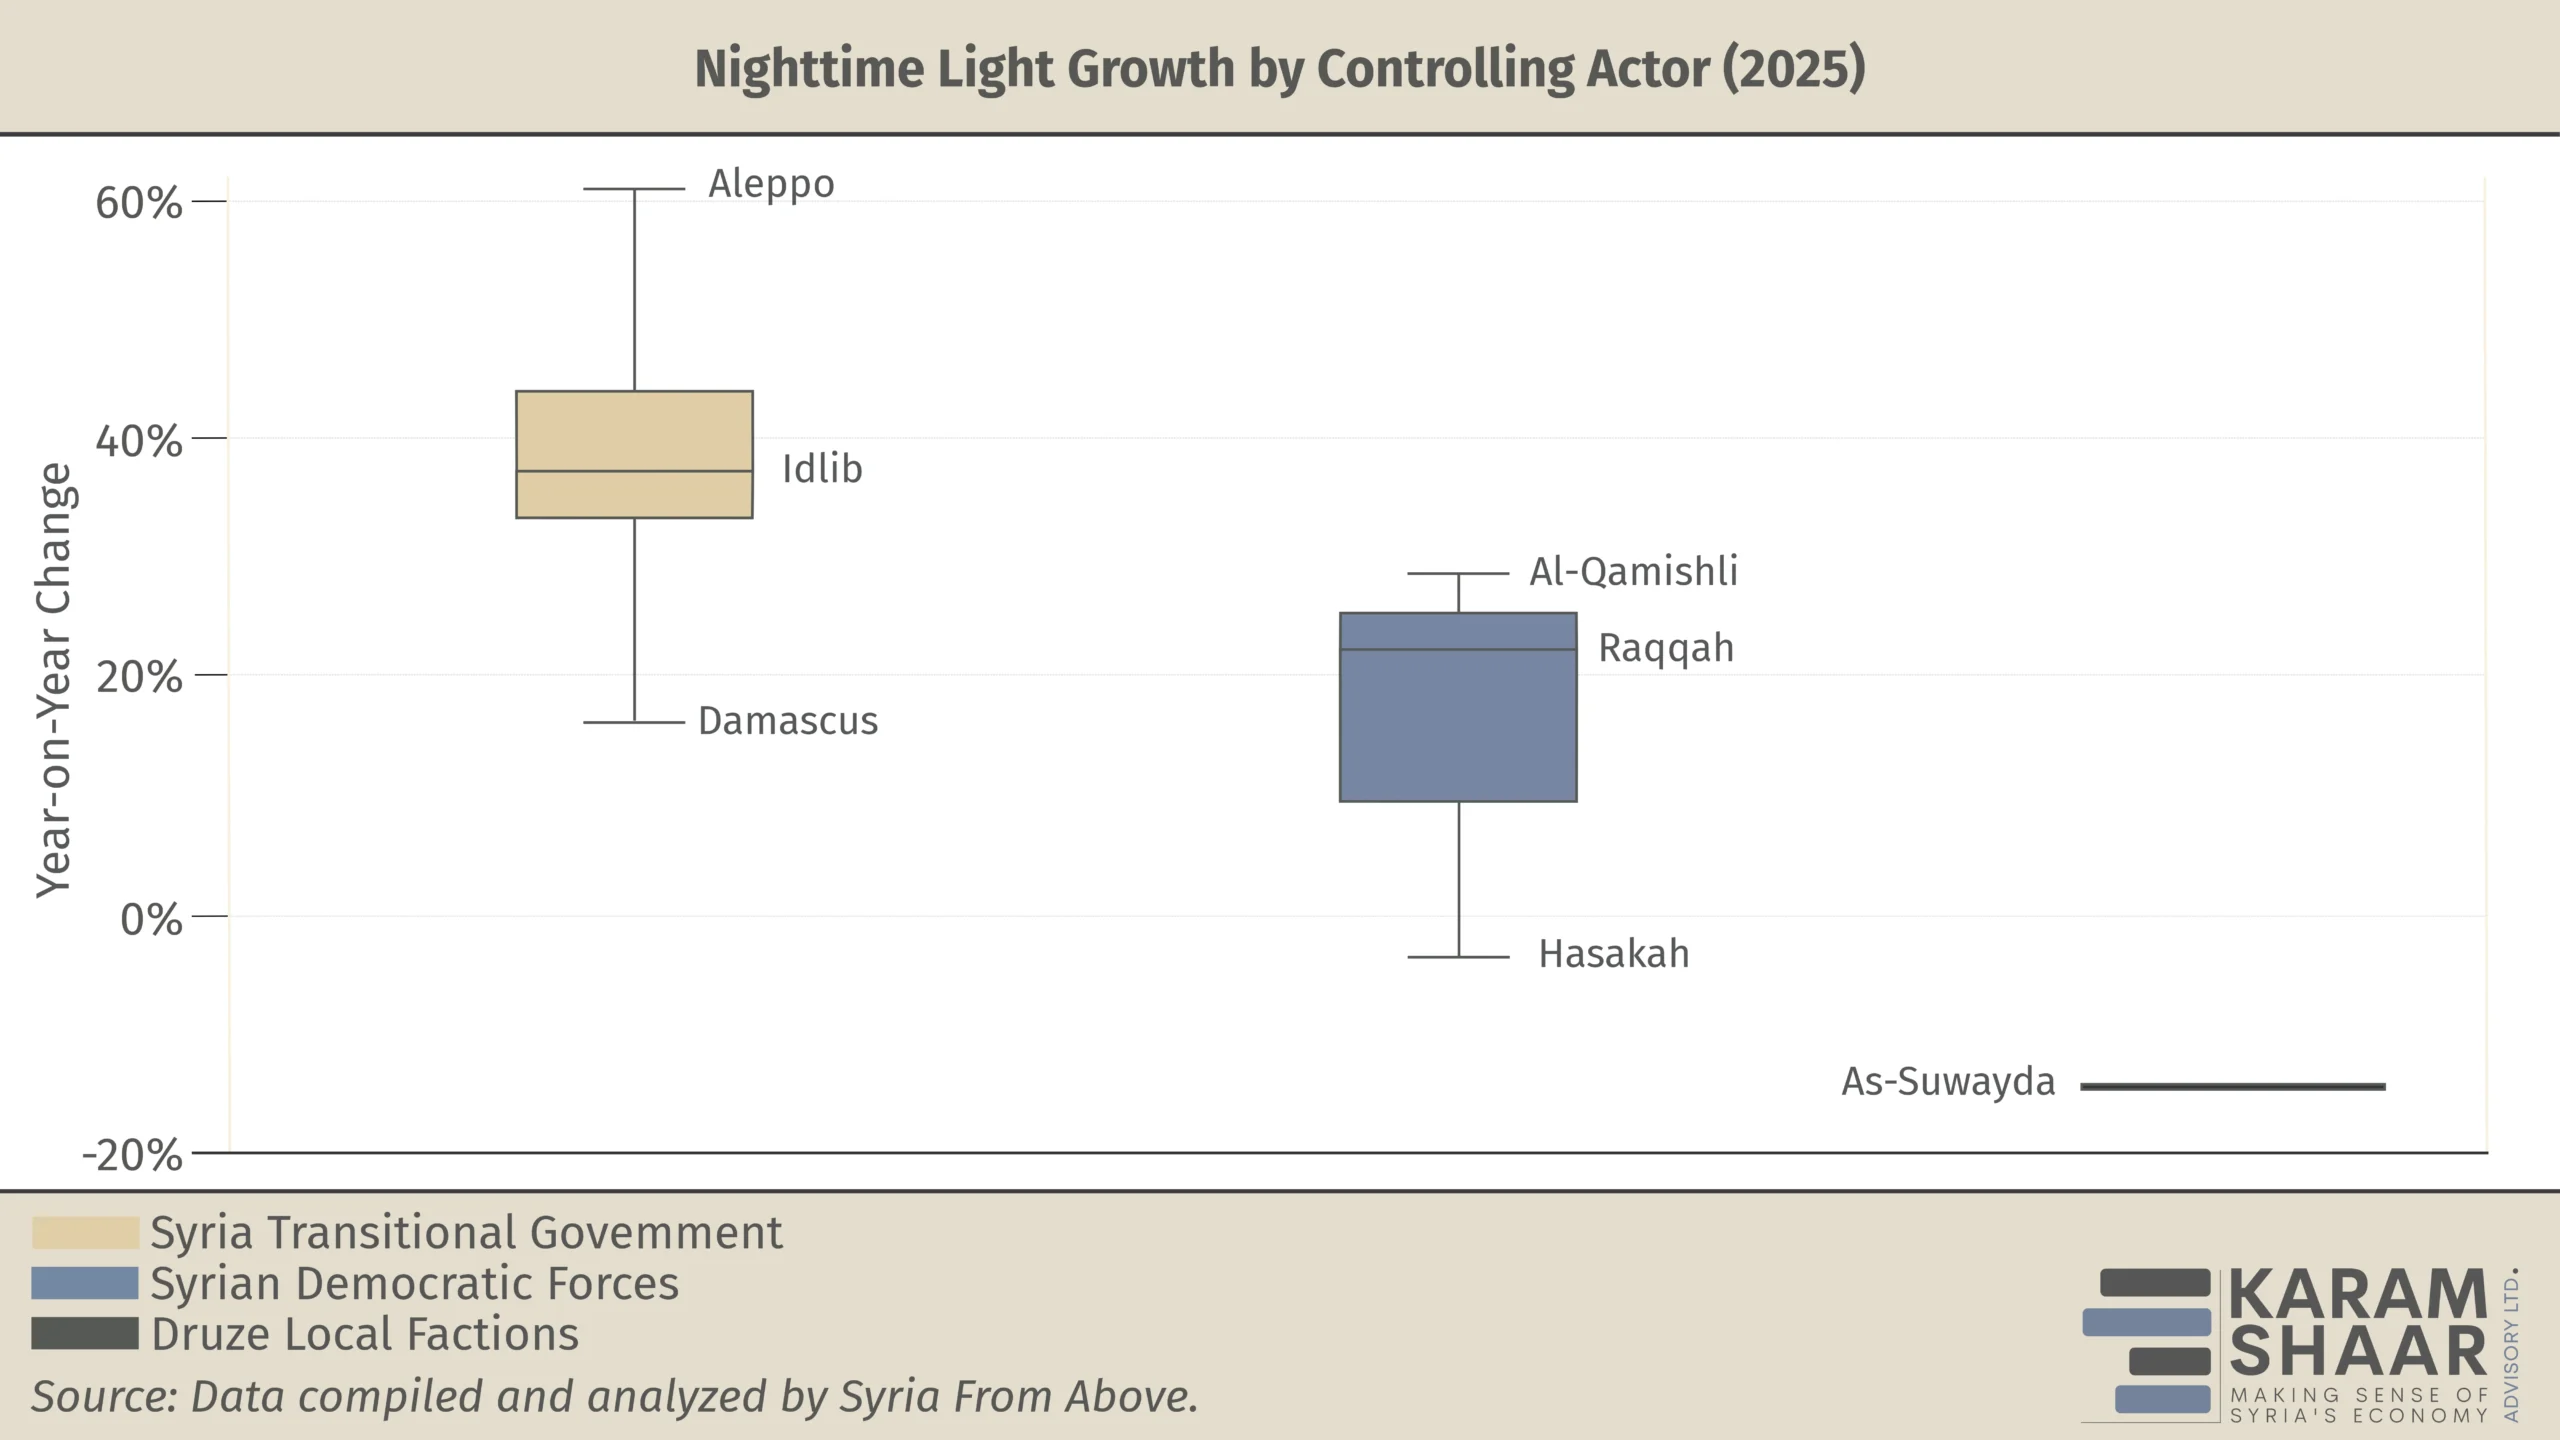
Grouping the data by controlling actor reveals a clear advantage for cities under transitional government authority (see chart above). All nine such cities recorded double-digit NTL growth in 2025, ranging from 17 to 61 percent.
By contrast, recovery in the northeast was mixed. Two of the three cities controlled by the Syrian Democratic Forces (SDF) recorded growth of 22 and 28 percent, while Hasakah declined by 3 percent.
The median city under transitional government control recorded 66 percent more growth (36.2 percent) than the median city under SDF control (21.8 percent). This gap is also visible spatially, with more uniform growth across transitional government-held cities and more fragmented patterns elsewhere (see the spatial distribution chart above).
Finally, Sweida—the only major city under the control of local Druze factions—remains an outlier, recording a 32 percent decline. Together, these patterns indicate that political authority structures strongly shaped Syria’s recovery in 2025.
Conclusion
One year after the fall of the Assad regime, NTL data suggest that Syria has entered a phase of recovery marked by structural improvement rather than short-term fluctuation. Yet this recovery remains geographically fragmented and politically uneven.
While satellite data cannot capture welfare, governance, or institutional quality, they offer a neutral lens through which early recovery dynamics can be assessed in the absence of reliable economic statistics. As the repeal of the US Caesar Act begins to translate into material changes on the ground and political arrangements continue to evolve, future shifts in NTL patterns will provide an early signal of whether Syria’s recovery consolidates or fractures further along political lines.