As sanctions continue to ease, the EU should take concrete steps to support Syria’s recovery, starting with Autonomous Trade Measures (ATMs) that temporarily suspend tariffs and quotas on Syrian exports. Similar steps taken for Ukraine in 2022 stimulated production, investment, and trade without requiring a formal free trade agreement.
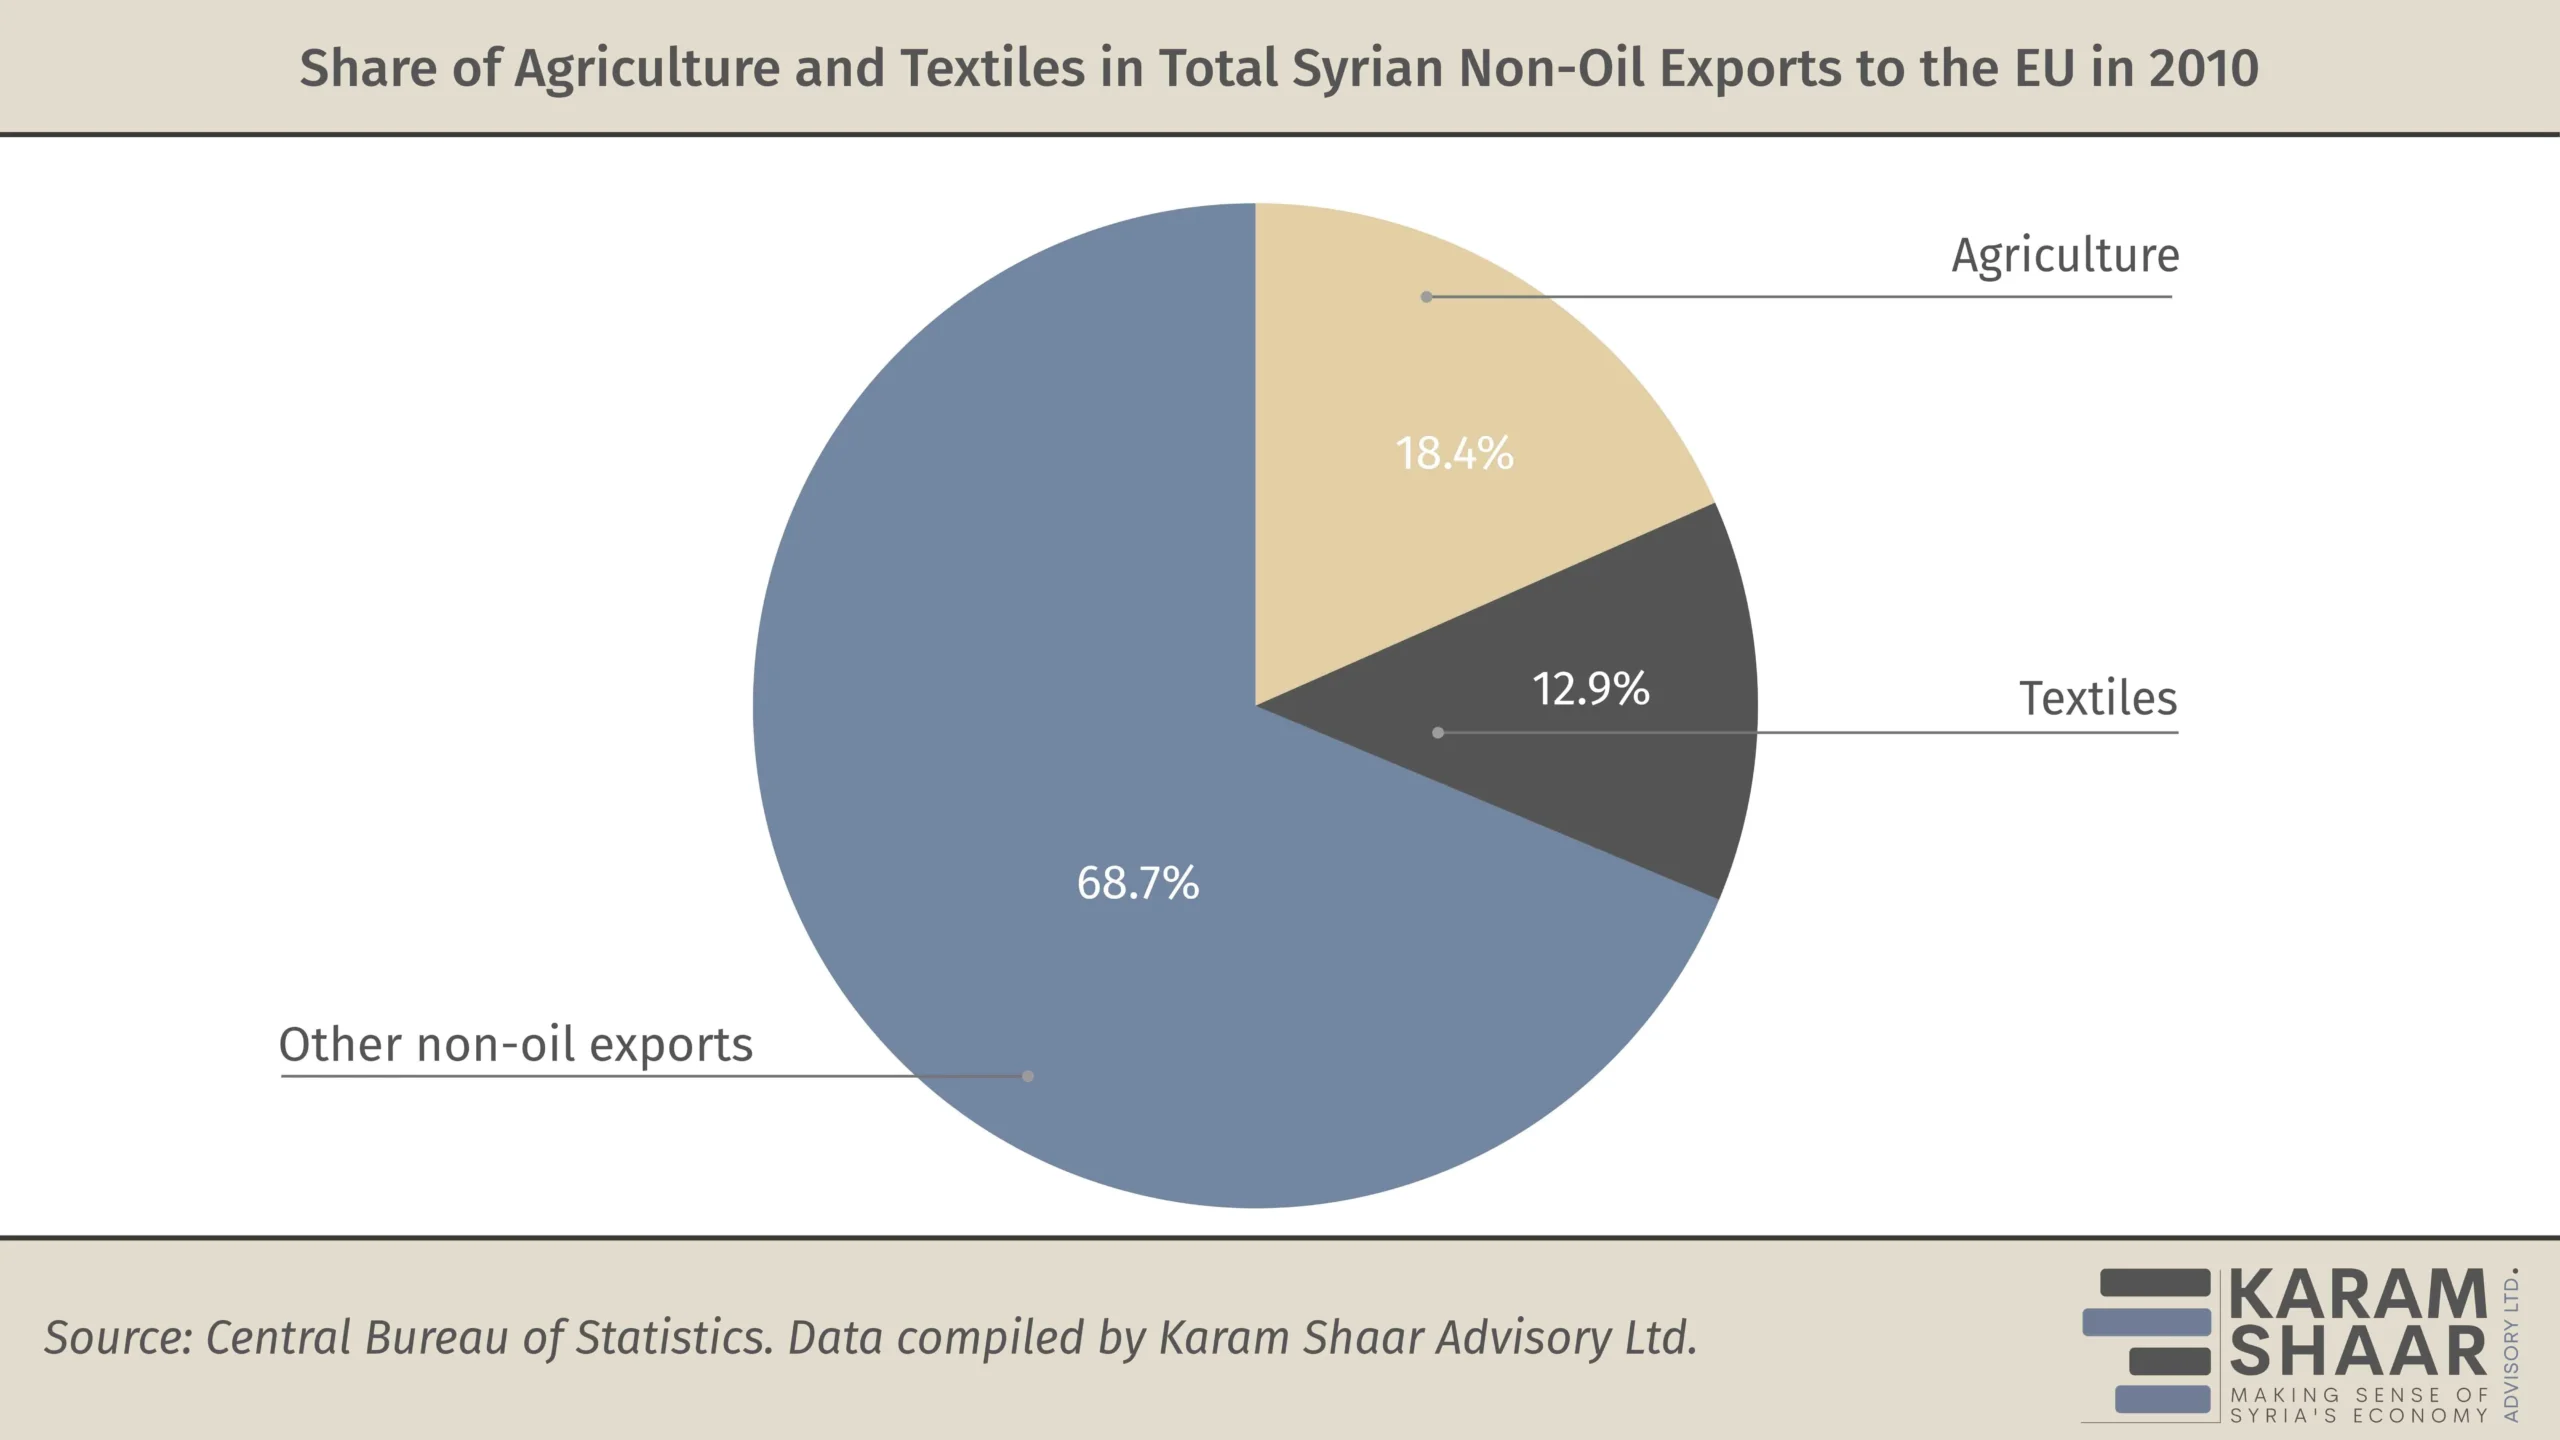
With Syria’s economy today marked by a collapsed industrial base and a persistent trade deficit draining foreign currency reserves, tariff-free access could boost recovery on multiple fronts. Favorable export terms would help revive key sectors—particularly agriculture and textiles, which accounted for a major share of non-oil European imports before the conflict.
For the EU, tariff-free access offers a way to shift from dwindling humanitarian aid toward longer-term support. It could help restore trade and banking ties, promote regional stability, and improve conditions for refugee returns by supporting post-conflict recovery.
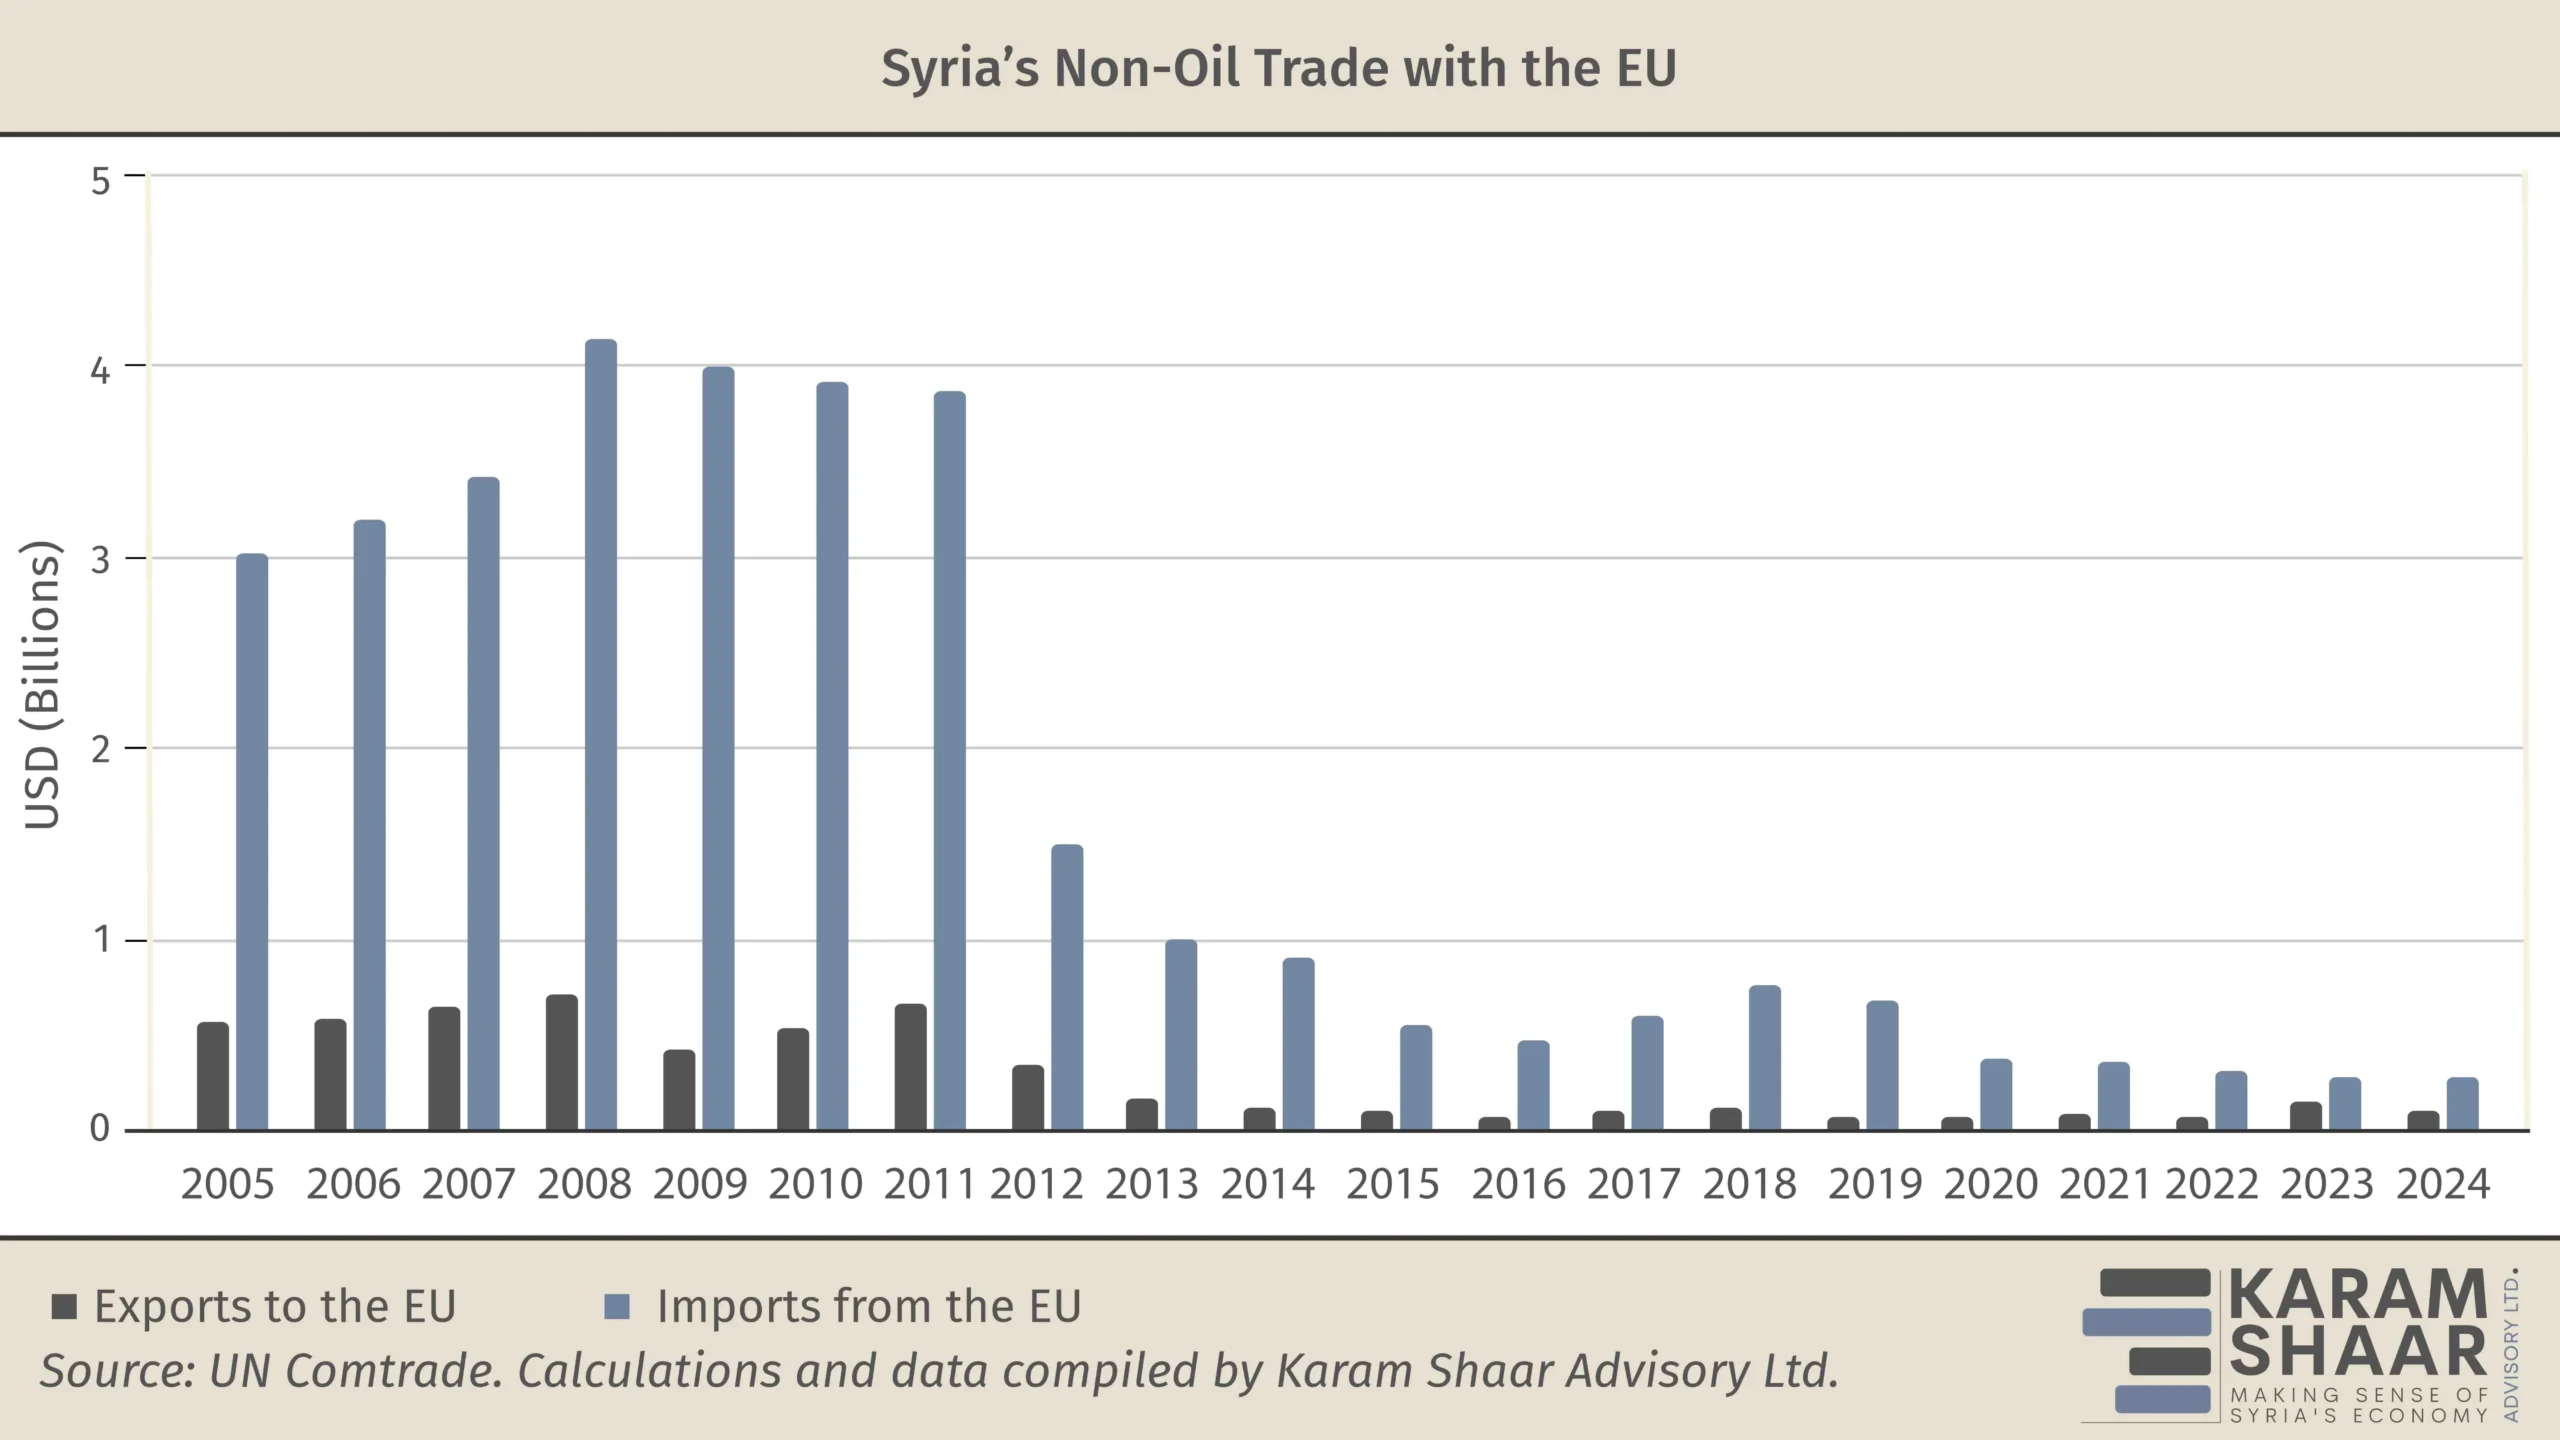
Before the conflict, the EU was Syria’s top export destination, accounting for 54% of total exports in 2010, according to UN Comtrade. Of the country’s USD 8.8 billion in exports, USD 4.8 billion went to the EU, largely in oil products. A return to such volumes is unlikely in the short term, given territorial fragmentation, reduced output, and the need to prioritize domestic consumption over exports.
Top EU Imports from Syria (2010)
HS Code | Short Product Name | Sector | Value (USD) |
27 | Mineral fuels and oils | Energy | 4,225,970,605 |
25 | Salt, sulfur, earths, and stone | Minerals / Raw Materials | 129,429,257 |
52 | Cotton and cotton products | Textiles / Agriculture | 65,993,558 |
61 | Knitted apparel | Textiles / Apparel | 53,242,202 |
41 | Raw hides and leather | Leather | 43,176,049 |
84 | Machinery and mechanical parts | Machinery / Industrial | 32,986,940 |
76 | Aluminum and articles thereof | Metals / Manufacturing | 32,451,000 |
05 | Animal products (e.g., guts) | Agri-Food / By-products | 20,381,768 |
09 | Coffee, tea, and spices | Agriculture / Spices | 16,881,251 |
62 | Woven apparel | Textiles / Apparel | 15,059,868 |
39 | Plastics and articles thereof | Chemicals / Manufacturing | 14,739,972 |
85 | Electrical machinery | Electronics / Industrial | 12,948,232 |
08 | Edible fruits and nuts | Agriculture / Food | 11,571,277 |
| Source: UN Comtrade. Data compiled by Karam Shaar Advisory Ltd. | |||
Today’s modest trade figures stand in stark contrast to pre-conflict levels. Between 2005 and 2010 average annual non-oil exports to the EU reached USD 594.4 million, compared to just USD 103.7 million between 2012 and 2024.
One useful point of comparison is Ukraine, where the impact of ATMs since June 2022 is instructive. UN Comtrade data shows sharp increases in EU imports of Ukrainian agricultural goods between 2021 and 2024. Other sectors—such as heavy industry and metals—declined, largely due to wartime disruptions and shifts toward domestic needs.
Top EU Imports from Ukraine before and after the implementation of Autonomous Trade Measures (2021–2024)
HS Code | HS Code Name | Direct Military Use? | 2021 (before ATMs) | 2024 (after ATMs) | % Change (EU) |
10 | Cereals | No | $2,068,585,972 | $4,795,237,566 | 131.81% |
15 | Animal or vegetable fats and oils | No | $2,450,598,105 | $3,303,336,278 | 34.80% |
12 | Oil seeds and oleaginous fruits | No | $1,614,233,312 | $2,652,902,875 | 64.34% |
72 | Iron and steel | Yes | $5,914,202,538 | $2,069,145,444 | -65.01% |
26 | Ores, slag, and ash | Yes | $3,526,880,525 | $2,068,198,714 | -41.36% |
85 | Electrical machinery/ equipment | Yes | $2,244,821,471 | $1,742,556,478 | -22.37% |
44 | Wood and articles of wood | Possibly | $1,626,397,095 | $1,396,447,012 | -14.14% |
23 | Residues and waste from food industries | No | $509,405,094 | $878,117,478 | 72.38% |
94 | Prefabricated buildings, furniture, and lighting | Possibly | $747,842,475 | $728,123,296 | -2.64% |
73 | Articles of iron or steel | Yes | $597,477,030 | $530,575,018 | -11.20% |
| Source: UN Comtrade. Data compiled by Karam Shaar Advisory Ltd. | |||||
Even in sectors that declined, EU imports from Ukraine fell less sharply than the global average. Between 2021 and 2024, EU imports of iron and steel dropped by 65%, compared to a 73% global decrease. Imports of ores, slag, and ash declined by 41.4%, versus 51.3% worldwide.
In some key agricultural sectors, the EU introduced safeguard measures to protect local producers from a surge of cheap duty-free imports, underscoring the effectiveness of ATMs in boosting Ukrainian exports. But similar risks appear minimal in Syria’s case. As of 2024, total exports to the EU—with oil excluded due to existing sanctions—stood at just USD 111 million. Even in 2010, non-oil exports totaled only USD 534.4 million, well below Ukraine’s USD 28.4 billion in exports to the EU in 2021, prior to the introduction of ATMs (per UN Comtrade).
Policy Safeguards and Considerations
While ATMs could provide significant economic benefits to Syria at minimal cost to the EU, certain risks must be addressed.
The primary concern is trade diversion, where neighboring countries may see their exports undercut by less competitive goods rerouted through Syria. To mitigate this, any ATM arrangement should be temporary and framed explicitly as post-conflict support: a bridge to renewed economic ties, increased investment, stronger local production, and eventually a formal trade agreement.
Widespread smuggling also poses a risk, particularly the re-export of non-Syrian goods under false certificates of origin. In the Ukrainian case, EU ATMs were conditional on rules-of-origin compliance. A Syrian ATM package should likewise be paired with EU-backed efforts to strengthen customs enforcement, origin verification, sanitary controls, and product safety oversight.
Another challenge is ensuring Syrian producers can actually benefit from new trade preferences. For example, Syria qualifies under the EU’s Generalised Scheme of Preferences, which removes EU import duties for vulnerable developing countries. But it used less than 1% of these benefits in 2023, likely due to low awareness, complex documentation, and weak institutional capacity.
Unlike formal trade agreements, ATMs require no negotiations. Given the precedent set with Ukraine, offering similar concessions to Syria represents a straightforward, low-cost, and high-impact step.